Randomized experiments

Lecture 12

Author
Affiliation

Josh Lim and John Zito

Duke University
STA 101 Fall 2026

Published

October 15, 2026

The problem of causality

What we truly care about

So often our examples were motivated by a lurking causal question that we couldn’t really answer because our data were purely observation:

  • (Bechdel) does increased female representation in a film cause its box office prospects to improve or decline?
  • (Gerrymandering) does increased gerrymandering cause a party’s electoral chances to improve or decline?
  • (A girl’s best friend) do the 4Cs cause a diamonds price to go up or down?

Correlation ≠ causation

  • So far, we have said to “avoid” causal language when describing the relationship between two variables;
  • Why? Because only in certain circumstances can we conclude causality;
  • These next three lectures explore some of the circumstances in which we can support the claim: “A causes B.”

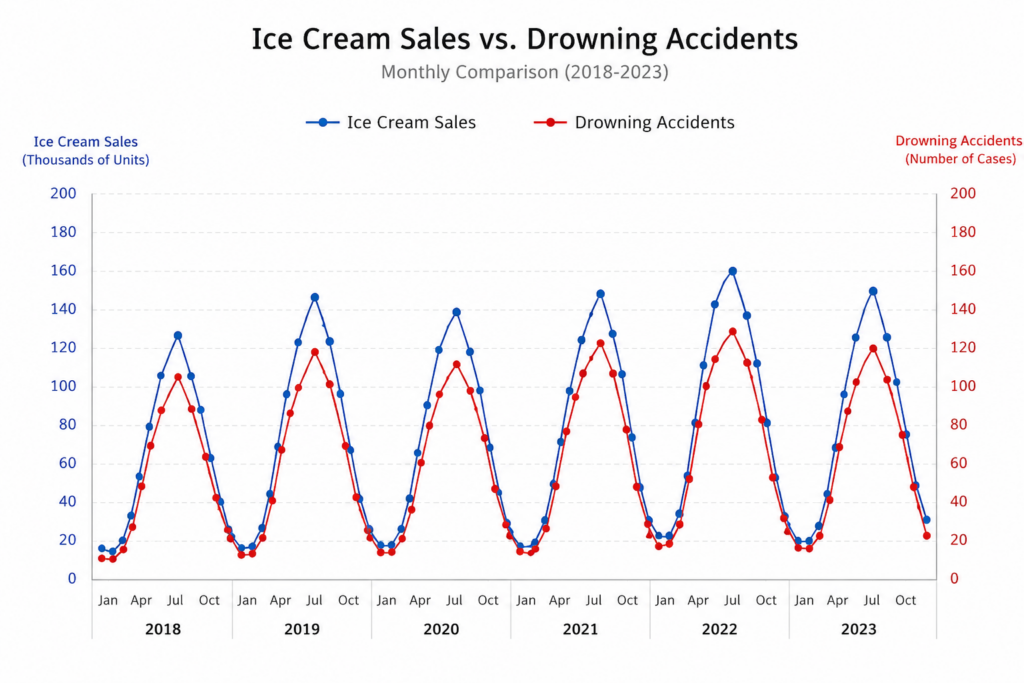
What’s going on here

Well yes

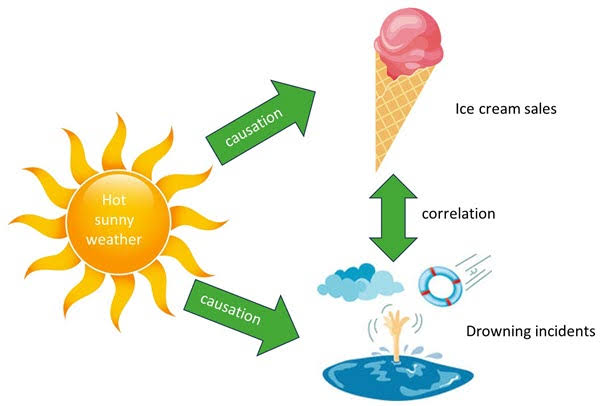
Confounding variables

  • A confounding variable is an outside variable that affects both variables of interest, creating a “false” association between them;
  • Students who live in Hollows have more free time in the second semester → the confounder is senior status;
  • Athletes with larger caloric intake are more likely to have knee problems → the confounder is height/body size;
  • Come up with your own!

So how do we deal with confounding variables?

We can deal with confounders before or after we collect the data.

Design

  • Meticulously plan your data collection and treatment assignment;
  • Eliminate possible confounder effects from the start;
  • Example: randomize who gets treatment so groups start out comparable.

Modeling / Analysis

  • Collect your data, then adjust for confounders statistically;
  • Include confounders as covariates in a regression model;
  • Example: control for age and sex when estimating a treatment effect

Key takeaway

  • Confounding variables make it hard to conclude that \(A\) causes \(B\);

  • But if we can remove or account for the effects of confounding — either by design or by modeling — we can conclude causality.

Randomized Experiments

What is a randomized experiment?

  • A study in which the researcher assigns units (people, schools, hospitals, …) to treatment or control;

  • Assignment uses a random mechanism — like a coin flip — not the unit’s own choice or the researcher’s judgment;

  • This is in contrast to an observational study, where we observe but do not intervene;

  • Examples: clinical drug trials, A/B tests, policy evaluations.

Some definitions

  • \(Z \in \{0, 1\}\): treatment indicator — 1 if a unit receives treatment, 0 if control;

  • \(X\): covariates — pre-treatment background variables (age, sex, baseline health, …);

  • \(Y\): outcome — the quantity we want to understand causally (recovery, test score, revenue, …);

  • Treatment group: units assigned \(Z = 1\);

  • Control group: units assigned \(Z = 0\).

Some jargon you’ll hear

  • Placebo: a “fake” treatment (eg. a sugar pill) given to the control group; indistinguishable from the real treatment;

  • Single-blind: participants do not know their treatment assignment;

  • Double-blind: neither participants nor the researchers administering treatment know the assignment — guards against bias on both sides.

Today’s example

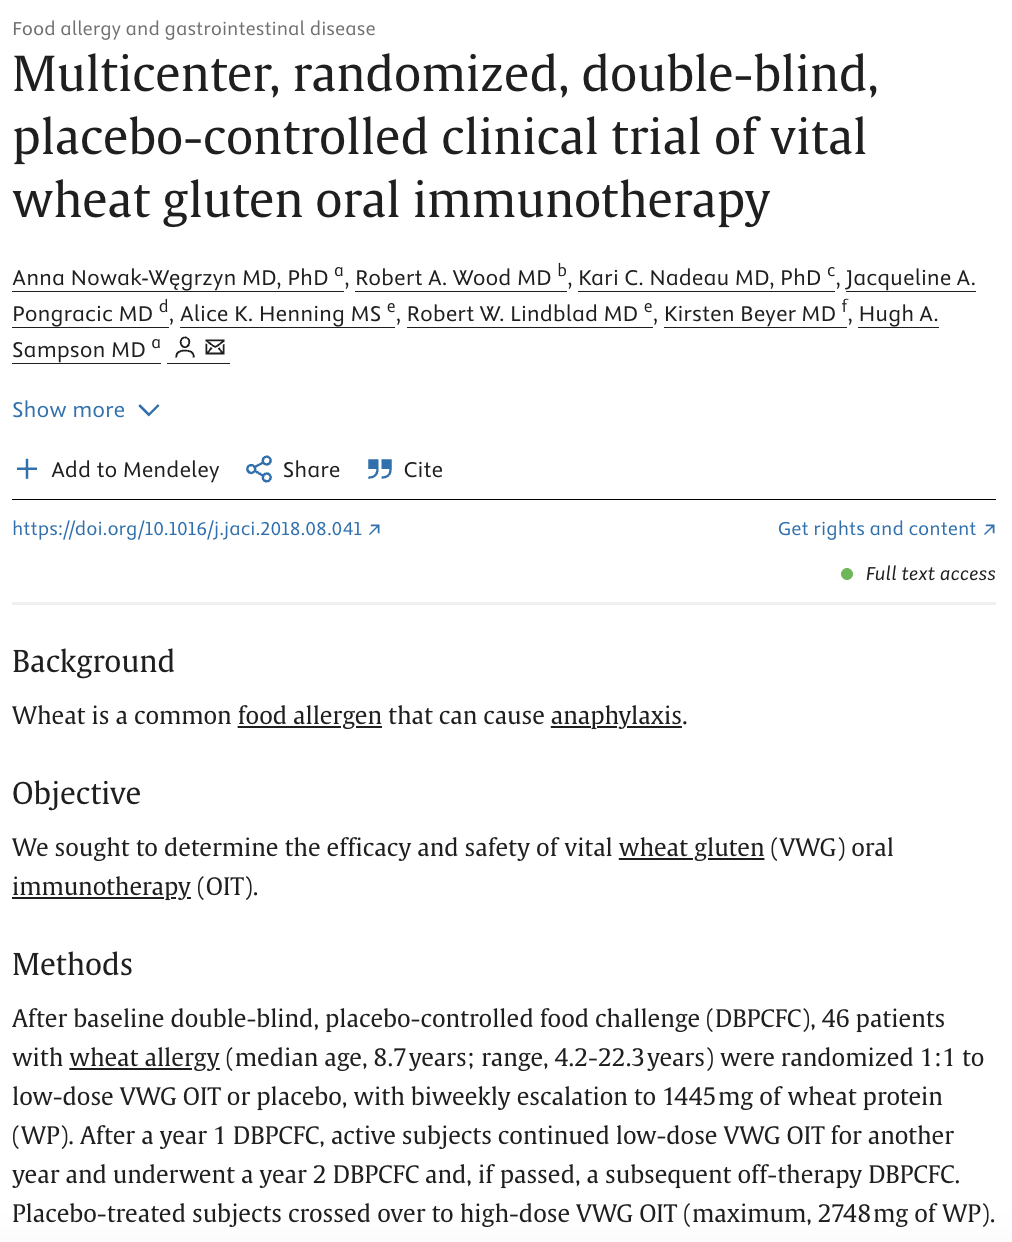
https://pubmed.ncbi.nlm.nih.gov/30389226/

Your turn

Using the paper (https://pubmed.ncbi.nlm.nih.gov/30389226/), identify the following:

  • Cohort: Who are the study participants?
  • Design: How was the data collected?
  • Treatment and control (\(Z\)): What did each group receive?
  • Outcome (\(Y\)): What is being measured?
  • Covariates (\(X\)): What pre-treatment variables were recorded?

Example: The Wheat OIT Study

Nowak-Węgrzyn et al., Journal of Allergy and Clinical Immunology (2019) — https://pubmed.ncbi.nlm.nih.gov/30389226/

  • Cohort: 46 children and young adults (ages 4–22) with confirmed wheat allergy;

  • Design: Multicenter, randomized, double-blind, placebo-controlled Phase 2 trial;

  • Treatment (\(Z=1\)): Vital wheat gluten (VWG) oral immunotherapy — biweekly escalation to 1,480 mg wheat protein/day over 1 year;

  • Control (\(Z=0\)): Matched placebo — participants and researchers blinded to assignment;

  • Outcome (\(Y\)): Passing a 1,480 mg double-blind placebo-controlled food challenge (DBPCFC) at year 1;

  • Covariates (\(X\)): Age, sex, baseline wheat IgE, threshold dose at baseline.

The gold standard

Randomization is incredibly powerful:

  • Treatment \(Z\) is assigned independently of everything (\(Z \perp X\));

  • This includes measured confounders and unmeasured confounders;

  • Even if confounders exist, they are (on average) distributed evenly across both groups — so they don’t bias our estimate;

  • Any average difference in \(Y\) between groups must be due to \(Z\), not a confounder;

  • This is why RCTs are considered the gold standard for causal inference.

Checking randomization: Covariate Balance

  • Randomization creates two comparable groups — the only systematic difference should be the treatment itself;

  • We verify this empirically with a balance table (called “Table 1” in medical research);

  • Compare means and proportions of key pre-treatment covariates across the two groups;

  • Good balance → confident that differences in \(Y\) are attributable to \(Z\).

Table 1: Wheat OIT Study

Characteristic Placebo (n = 23) VWG OIT (n = 23)
Age (years), mean (SD) 8.1 (3.9) 7.8 (4.1)
Female, \(n\) (%) 9 (39%) 10 (43%)
Wheat IgE (kU/L), median 31.4 29.8
Threshold dose at baseline (mg), median 200 200
  • Groups look similar on all pre-treatment characteristics
  • This is exactly what we expect under randomization

When covariate balance is violated…

  • If groups differ on \(X\) before treatment, we can’t be sure whether differences in \(Y\) are due to \(Z\) or \(X\);

  • Example: if the treatment group happens to be younger on average, better outcomes might reflect age — not the treatment;

  • Solution 1: include the imbalanced covariate(s) in your regression model;

  • Solution 2: rerandomize — if the initial draw produces an imbalanced allocation, redraw until balance is achieved (can be built into the design ahead of time).

Ok, so we have balance, now what?

  • Now our question is: does the change in our treatment affect our outcome \(Y\)?

  • I.e., does switching from the control group to our treatment group produce a meaningful change in \(Y\) on average?

  • We can estimate this directly as the difference in group means:

    \[\tau = \bar{Y}_{\text{treated}} - \bar{Y}_{\text{control}}\]

Linear regression with a binary treatment

\[ \hat{Y}_i = b_0 + b_1 Z_i \]

  • \(b_0\): predicted outcome in the control group (\(Z = 0\));

  • \(b_1\): estimated average treatment effect — the average change in \(Y\) when going from control to treatment;

  • In fact, \(b_1 = \bar{Y}_{\text{treated}} - \bar{Y}_{\text{control}}\) exactly.

Data: Wheat OIT Trial

glimpse(wheat_trial)
Rows: 46
Columns: 5
$ id                 <int> 1, 2, 3, 4, 5, 6, 7, 8, 9, 10, 11, 12, 13, 14, 15, …
$ age                <dbl> 20.5, 20.9, 9.2, 18.9, 15.6, 13.3, 17.3, 6.4, 15.8,…
$ baseline_wheat_ige <dbl> 13.3, 7.1, 30.8, 32.4, 38.6, 17.1, 90.6, 14.9, 10.6…
$ vwg_oit            <dbl> 1, 1, 1, 1, 1, 1, 1, 1, 1, 1, 1, 1, 1, 1, 1, 1, 1, …
$ max_dose_mg        <dbl> 1331, 1391, 1126, 960, 1197, 1175, 1052, 1184, 1384…
Note

This dataset is artificially generated to represent the structure of the real study. In practice, clinical trial data like this is Protected Health Information (PHI) — individually identifiable health data (e.g. diagnoses, lab values, treatment records) protected under HIPAA — and cannot be shared publicly.

Research question

Is VWG oral immunotherapy effective at increasing wheat tolerance?

. . .

More precisely: is there a significant relationship between VWG OIT treatment and maximum tolerated wheat protein dose?

. . .

\[H_0: \beta_1 = 0 \qquad H_A: \beta_1 \neq 0\]

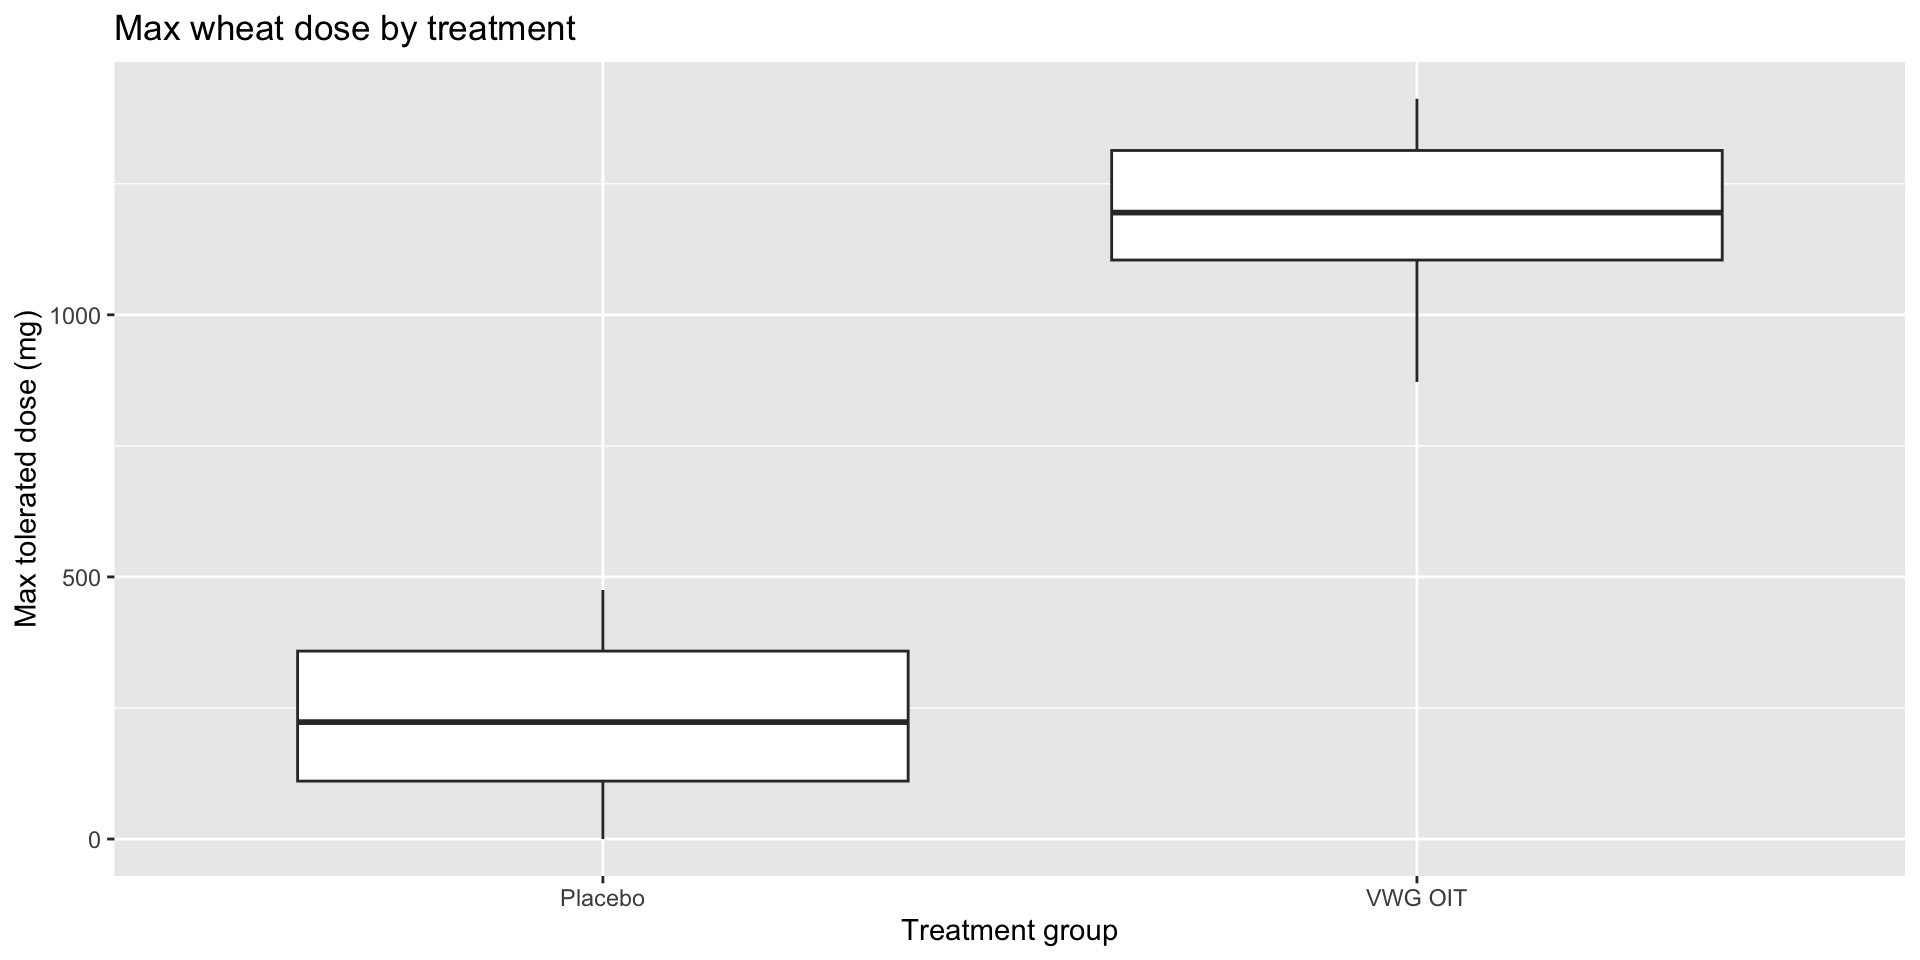
Visualize

ggplot(
  wheat_trial,
  aes(
    x = factor(vwg_oit, labels = c("Placebo", "VWG OIT")),
    y = max_dose_mg
  )
) +
  geom_boxplot() +
  labs(
    x = "Treatment group",
    y = "Max tolerated dose (mg)",
    title = "Max wheat dose by treatment"
  )

wheat_trial |>
  group_by(vwg_oit) |>
  summarise(
    n        = n(),
    mean_dose = mean(max_dose_mg),
    sd_dose  = sd(max_dose_mg)
  )
# A tibble: 2 × 4
  vwg_oit     n mean_dose sd_dose
    <dbl> <int>     <dbl>   <dbl>
1       0    23      234.    156.
2       1    23     1201.    144.

Model fit

wheat_fit <- linear_reg() |>
  fit(max_dose_mg ~ vwg_oit, data = wheat_trial)

tidy(wheat_fit)
# A tibble: 2 × 5
  term        estimate std.error statistic  p.value
  <chr>          <dbl>     <dbl>     <dbl>    <dbl>
1 (Intercept)     234.      31.3      7.48 2.29e- 9
2 vwg_oit         967.      44.2     21.9  2.79e-25

Model interpret

\[\widehat{\text{max dose}} = b_0 + b_1 \times \text{VWG OIT}\]

  • Intercept: The estimated max tolerated dose for participants in the placebo group is \(b_0\) mg, on average.

  • vwg_oit: Receiving VWG OIT causes an estimated increase of \(b_1\) mg in max tolerated dose compared to placebo, on average.

Notice: our interpretation changed!

  • In every previous lecture, we bent over backwards to say: “A one-unit increase in \(Z\) predicts an average change in \(Y\) of \(b_1\);”

  • Now, we say “A one-unit increase in Z causes Y to change by \(b_1\), on average.”

  • We’ve eliminated the effect of confounding via randomization, so any changes in \(Y\) can be plausibly attributed to the change in \(Z\) alone.

Further covariate adjustment

If covariate balance is not satisfied, we can include those covariates in the model to adjust for them:

wheat_fit_adj <- linear_reg() |>
  fit(max_dose_mg ~ vwg_oit + baseline_wheat_ige, data = wheat_trial)

tidy(wheat_fit_adj)
# A tibble: 3 × 5
  term               estimate std.error statistic  p.value
  <chr>                 <dbl>     <dbl>     <dbl>    <dbl>
1 (Intercept)          312.      27.8       11.2  2.22e-14
2 vwg_oit              947.      34.2       27.7  4.57e-29
3 baseline_wheat_ige    -1.84     0.328     -5.62 1.31e- 6

Notice the standard error

Without covariate adjustment:

linear_reg() |>
  fit(max_dose_mg ~ vwg_oit, wheat_trial) |>
  tidy() |>
  select(term, estimate, std.error)
# A tibble: 2 × 3
  term        estimate std.error
  <chr>          <dbl>     <dbl>
1 (Intercept)     234.      31.3
2 vwg_oit         967.      44.2

With covariate adjustment:

linear_reg() |>
  fit(max_dose_mg ~ vwg_oit + baseline_wheat_ige, wheat_trial) |>
  tidy() |>
  select(term, estimate, std.error)
# A tibble: 3 × 3
  term               estimate std.error
  <chr>                 <dbl>     <dbl>
1 (Intercept)          312.      27.8  
2 vwg_oit              947.      34.2  
3 baseline_wheat_ige    -1.84     0.328

. . .

The point estimate of the treatment effect is similar, but estimation uncertainty is reduced. More on this in a few weeks.

Limitations of RCTs

  • Generalizability: The wheat OIT trial enrolled 46 children and young adults at a small number of academic medical centers. Results may not generalize to all ages, allergy severities, or healthcare settings;

  • Feasibility and cost: RCTs require careful coordination, long follow-up periods, and significant funding. Not every research question can be studied this way;

  • Ethical constraints: We can only randomize participants to treatments we believe are plausibly safe. We cannot randomly assign people to harmful exposures:

    • Example: we cannot randomize children without wheat allergies to develop an allergy just to study the effect;
    • Borderline cases (eg. deliberately inducing allergic reactions in a food challenge) require careful IRB oversight and informed consent.