Homework 2
Due: Friday September 18 at 10 AM
On this second homework, you’ll start thinking about statistical modeling with linear regression, so we need a new package for that:
Setup
- Log-in to your container;
- Double-check that you have the
sta101-f26-filesproject loaded in the upper-right corner of RStudio (this should always be true); - Go to the “Git” tab in the upper-right panel of RStudio and click the Pull button (arrow pointing down). Now the new assignment template and dataset should appear in the
hwfolder of your Files; - At the top of the new
.qmd, in between---, you have the settings for the document (the so-called YAML, but don’t worry about that). Modify theauthorso that it lists lil’ ol’ you.
Exercise 0
Recommend some music for us to listen to while we grade this.
Part 1: do you even lift?
We will be working with data from www.openpowerlifting.org. This data was sourced from Tidy Tuesday and contains international powerlifting records at various meets. At each meet, each lifter gets three attempts at lifting max weight on three lifts: the bench press, squat and deadlift.
ipf <- read_csv("data/ipf.csv")The data dictionary for this dataset from TidyTuesday is reproduced below:
| variable | description |
|---|---|
name |
Individual lifter name |
sex |
Binary gender (M/F) |
event |
The type of competition that the lifter entered. Values are as follows:
|
equipment |
The equipment category under which the lifts were performed. Values are as follows:
|
age |
The age of the lifter on the start date of the meet, if known. |
age_class |
The age class in which the filter falls, for example 40-45
|
division |
Free-form UTF-8 text describing the division of competition, like Open or Juniors 20-23 or Professional. |
bodyweight_kg |
The recorded bodyweight of the lifter at the time of competition, to two decimal places. |
weight_class_kg |
The weight class in which the lifter competed, to two decimal places. Weight classes can be specified as a maximum or as a minimum. Maximums are specified by just the number, for example |
best3squat_kg |
Maximum of the first three successful attempts for the lift. Rarely may be negative: that is used by some federations to report the lowest weight the lifter attempted and failed. |
best3bench_kg |
Maximum of the first three successful attempts for the lift. Rarely may be negative: that is used by some federations to report the lowest weight the lifter attempted and failed. |
best3deadlift_kg |
Maximum of the first three successful attempts for the lift. Rarely may be negative: that is used by some federations to report the lowest weight the lifter attempted and failed. |
place |
The recorded place of the lifter in the given division at the end of the meet. Values are as follows:
|
date |
ISO 8601 Date of the event |
federation |
The federation that hosted the meet. (limited to IPF for this data subset) |
meet_name |
The name of the meet. The name is defined to never include the year or the federation. For example, the meet officially called 2019 USAPL Raw National Championships would have the MeetName Raw National Championshps. |
For all of the following exercises, you should include units on axes labels, e.g. “Bench press (lbs)” or “Bench press (kg)”. “Age (years)” etc. This is good practice.
Exercise 1
Let’s begin by taking a look at the squat lifting records.
To begin, remove any observations that are negative for squat. Next, create a new column called best3_squat_lbs that converts the record from kg to lbs (you may have to Google the conversion). Save your data frame as ipf_squat. Report the number of rows and columns of this new data frame.
First, you’re taking a dataset and filtering it for certain records, and then you’re mutate-ing that dataset to gain a new column, and you’re assigning the resulting dataset to a new object called ipf_squat.
Exercise 2
Using ipf_squat from the previous exercise, create a scatter plot to investigate the relationship between squat (in lbs) and age. Age should be on the x-axis. Adjust the alpha level of your points to get a better sense of the density of the data. Add a linear trend-line. Be sure to label all axes and give the plot a title. Comment on what you observe.
Exercise 3
Write down the linear model to predict lift squat lbs from age in \(x\), \(y\), \(\beta\) notation. What is \(x\)? What is \(y\)? Next, fit the linear model, and save it as age_fit. Re-write your previous equation replacing \(\beta\) with the numeric estimates. This is called the “fitted” linear model. Interpret each estimate of \(\beta\). Are the interpretations sensible?
Exercise 4
Building on your ipf_squat data frame, create a new column called age2 that takes the age of each lifter and squares it. Save it to your data frame ipf_squat. Next, plot squat in lbs vs age2 and add a linear best fit line. Does this model look like it fits the data better?
To raise a value to a power, use ^ in R, e.g.: 2 ^ 2 gives you 4, 2 ^ 3 gives you 8, etc.
Exercise 5
One metric to assess the fit of a model is \(R^2\). Fit the age\(^2\) model and save the object as age2_fit. Compare \(R^2\) of the age\(^2\) model to the \(R^2\) of the model from Exercise 3. Which has a higher \(R^2\)?
Exercise 6
Next, let’s turn our attention to dead lifting records. To do this, you should start back from the original ipf data frame that you first read in. Ignore the new data frame you created for squat.
Recreate the plot below. Make sure axes and title labels are exactly matching, including spelling, capitalization, etc. Based on the plot below, which impacts deadlift weight more, age category or sex?
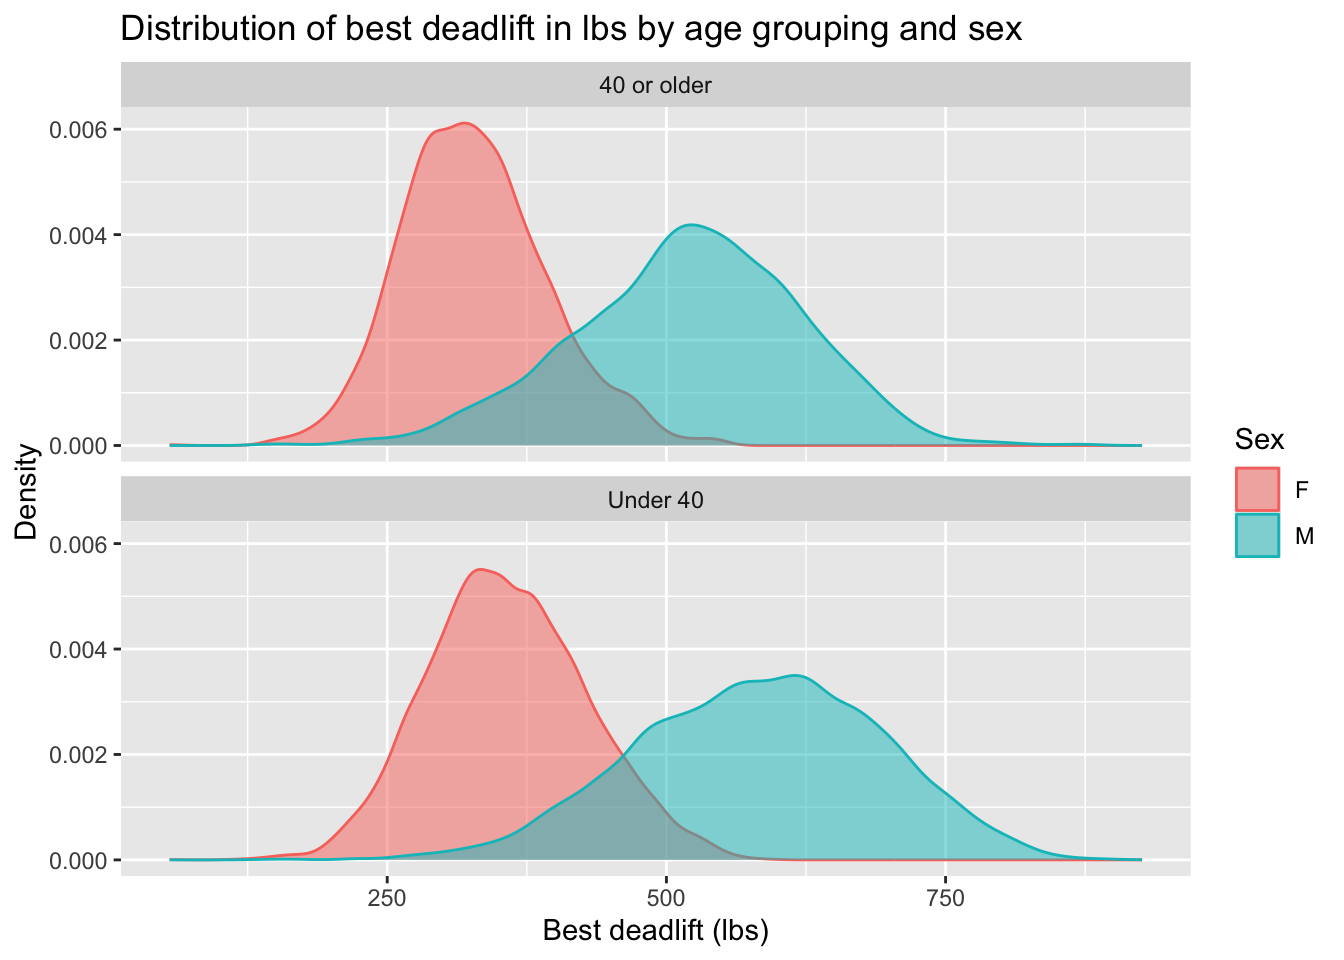
You will need to create a couple of new columns. One to classify age appropriately and one to convert best3deadlift_kg to the plotted units (lbs). Notice that there are no negative deadlift values on the x-axis.
Exercise 7
Finally, let’s turn our attention to bench press records. To do this, you should start back from the original ipf data frame that you first read in. Ignore the new data frames you created for squat and deadlift.
To begin, remove any observations that are negative for bench press, create two new columns: best3bench_lbs and bodyweight_lbs. Save the result in a new data frame called ipf_bench.
Then, create a scatter plot to investigate the relationship between best bench press (in lbs) and the lifter’s bodyweight (in lbs). Bodyweight should be on the x-axis. Add a linear trend-line. Be sure to label all axes and give the plot a title. Comment on what you observe.
Exercise 8
Fit the linear model displayed in the previous exercise and write down the fitted model equation only, replacing \(\hat{\beta}\)s with their fitted estimates. Interpret the \(\hat{\beta}\)s (intercept and slope). Report \(R^2\). Is body weight an important predictor of bench press ability? Why or why not?
Part 2: IMS exercises
These exercises from the textbook do not require code, but you should type your responses into the same Quarto file you’ve been using. Make sure to answer the questions in full sentences.
Exercise 9
IMS - Chapter 7 exercises, #18: Over-under, II.
Exercise 10
IMS - Chapter 7 exercises, #24: Cats weights.
Submission
- Hit the blue Render button to generate your final PDF;
- Give your work a final look over to double-check a few things:
- that your code is stylish;
- that none of your code or pictures runs off the page. We cannot grade what we cannot read;
- that all of your plots are well-labeled and human-readable. In other words “Flipper length (mm)” instead of
flipper_length_mm; - If your work is lacking on any of these items, fix them and re-render as needed;
- Download the PDF from your container;
- Upload it to Gradescope;
- Don’t forget to mark your pages.