AE 12: normal practice
In this application exercise, we’ll get some basic practice with the mechanics of the normal distribution (bell curve).
Packages and data
We’ll use the tidyverse and openintro packages.
Bone density
Suppose the bone density for 65-year-old women is normally distributed with mean 809 \(mg/cm^3\) and standard deviation of 140 \(mg/cm^3\).
Let \(x\) be the bone density of 65-year-old women. We can write this distribution of \(x\) in mathematical notation as
\[ x \sim N(\mu = 809, \sigma = 140) \]
Let’s set the parameters of this distribution as objects you can use later.
bone_density_mean <- 809
bone_density_sd <- 140
Exercise 1
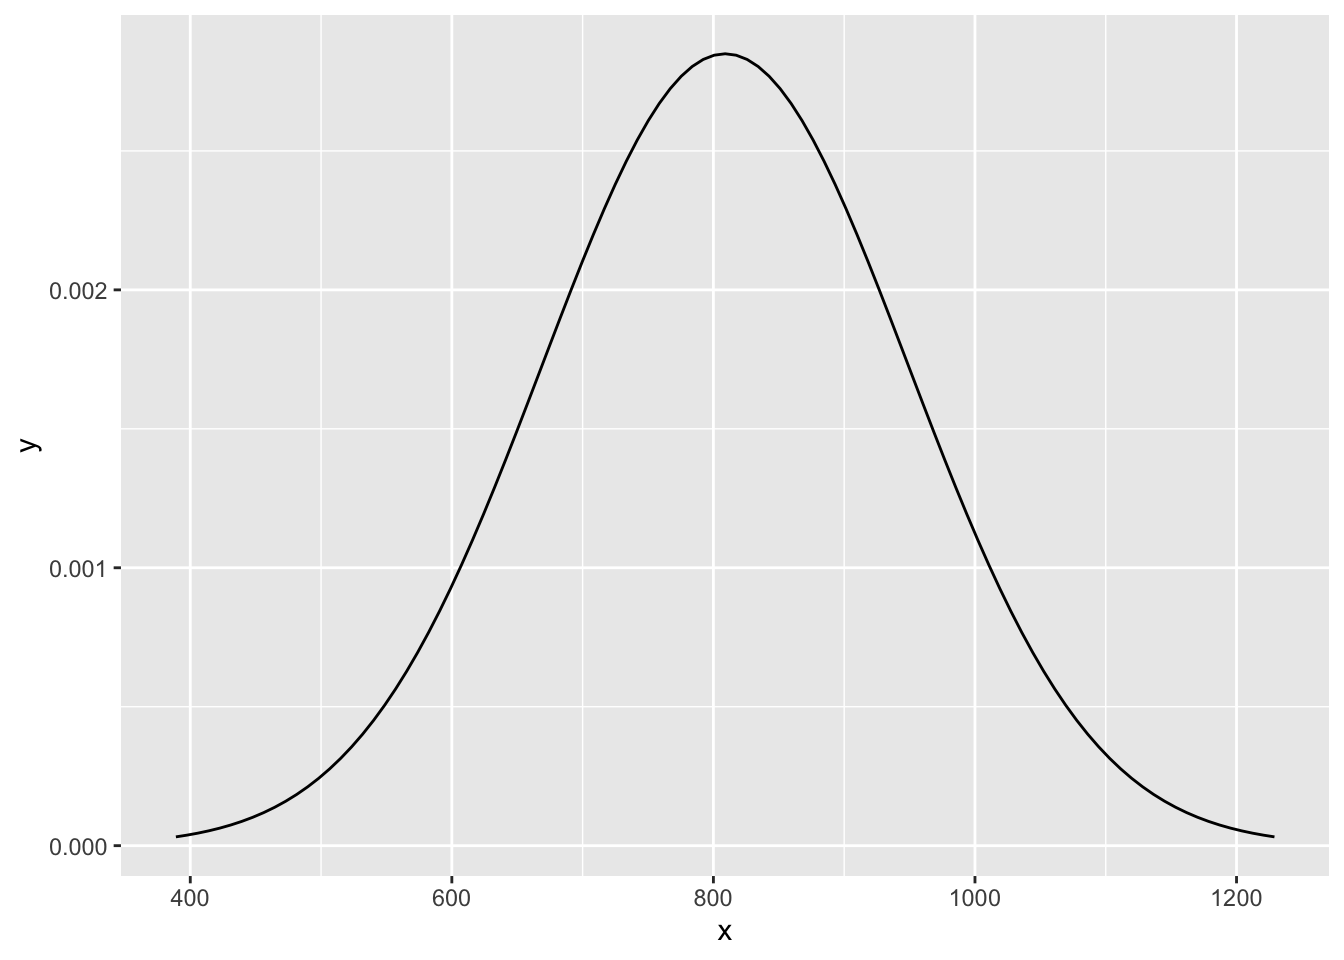
Visualize the distribution of bone density of 65-year-old women.
# option 1: ggplot2
ggplot(
  data = tibble(x = c(bone_density_mean - bone_density_sd*3, bone_density_mean + bone_density_sd*3)),
  aes(x = x)) +
  stat_function(
    fun = dnorm,
    args = list(mean = bone_density_mean, sd = bone_density_sd)
  )
# option 2: openintro -- shortcut
normTail(m = bone_density_mean, s = bone_density_sd)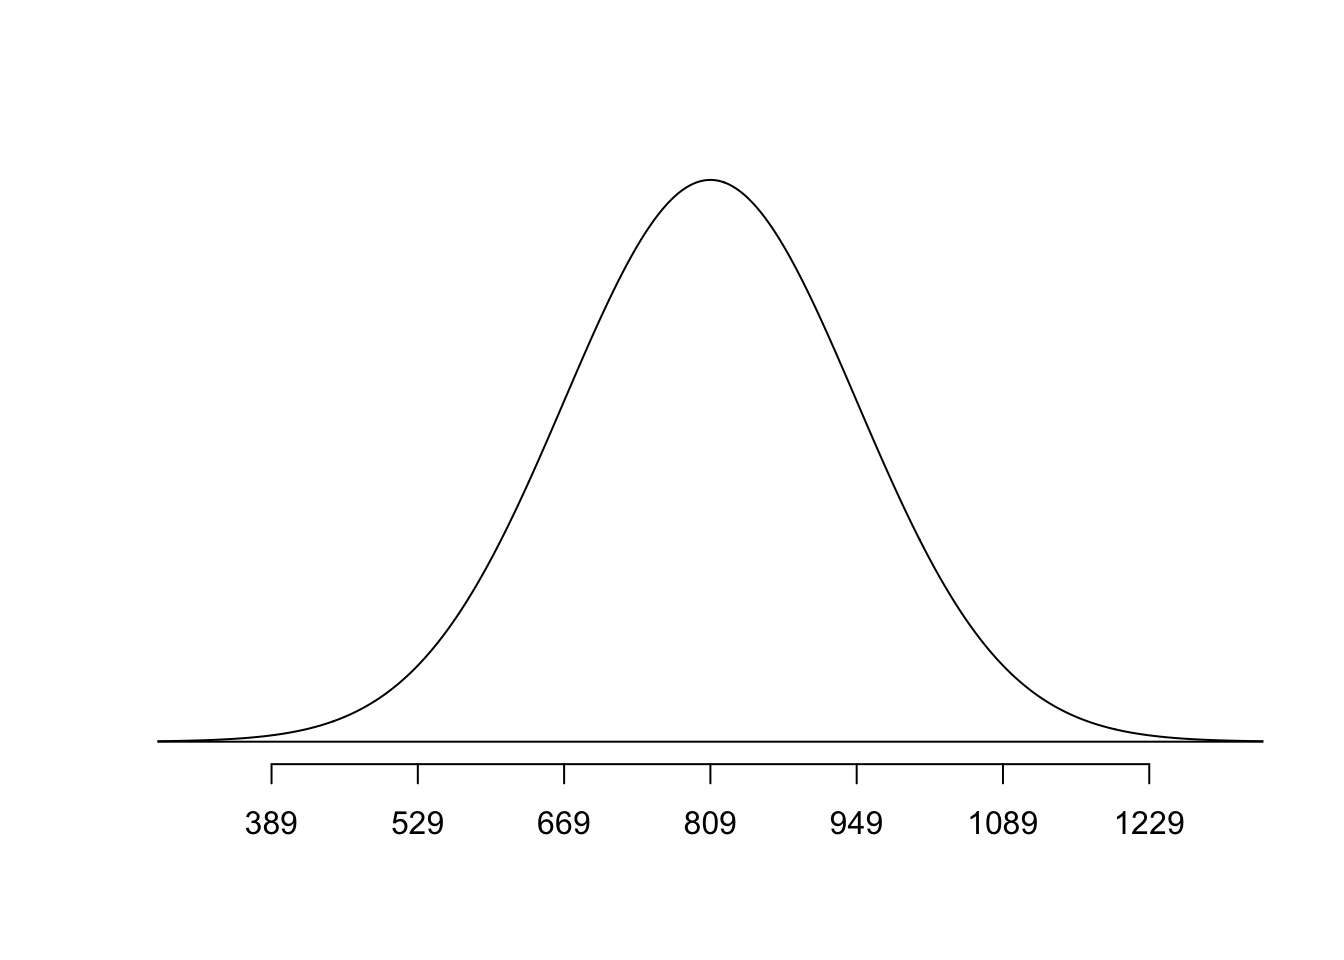
Exercise 2
Before typing any code, based on what you know about the normal distribution, what do you expect the median bone density to be?
809 \(mg/cm^3\), since mean and median are roughly equal for symmetric distributions.
Exercise 3
What bone densities correspond to Q1 (25th percentile), Q2 (50th percentile), and Q3 (the 75th percentile) of this distribution? Use the qnorm() function to calculate these values.
Exercise 4
The densities of three woods are below:
Plywood: 540 \(mg/cm^3\)
Pine: 600 \(mg/cm^3\)
Mahogany: 710 \(mg/cm^3\)
Let’s set these as variables we can use later:
plywood <- 540
pine <- 600
mahogany <- 710
What is the probability that a randomly selected 65-year-old woman has bones less dense than Pine?
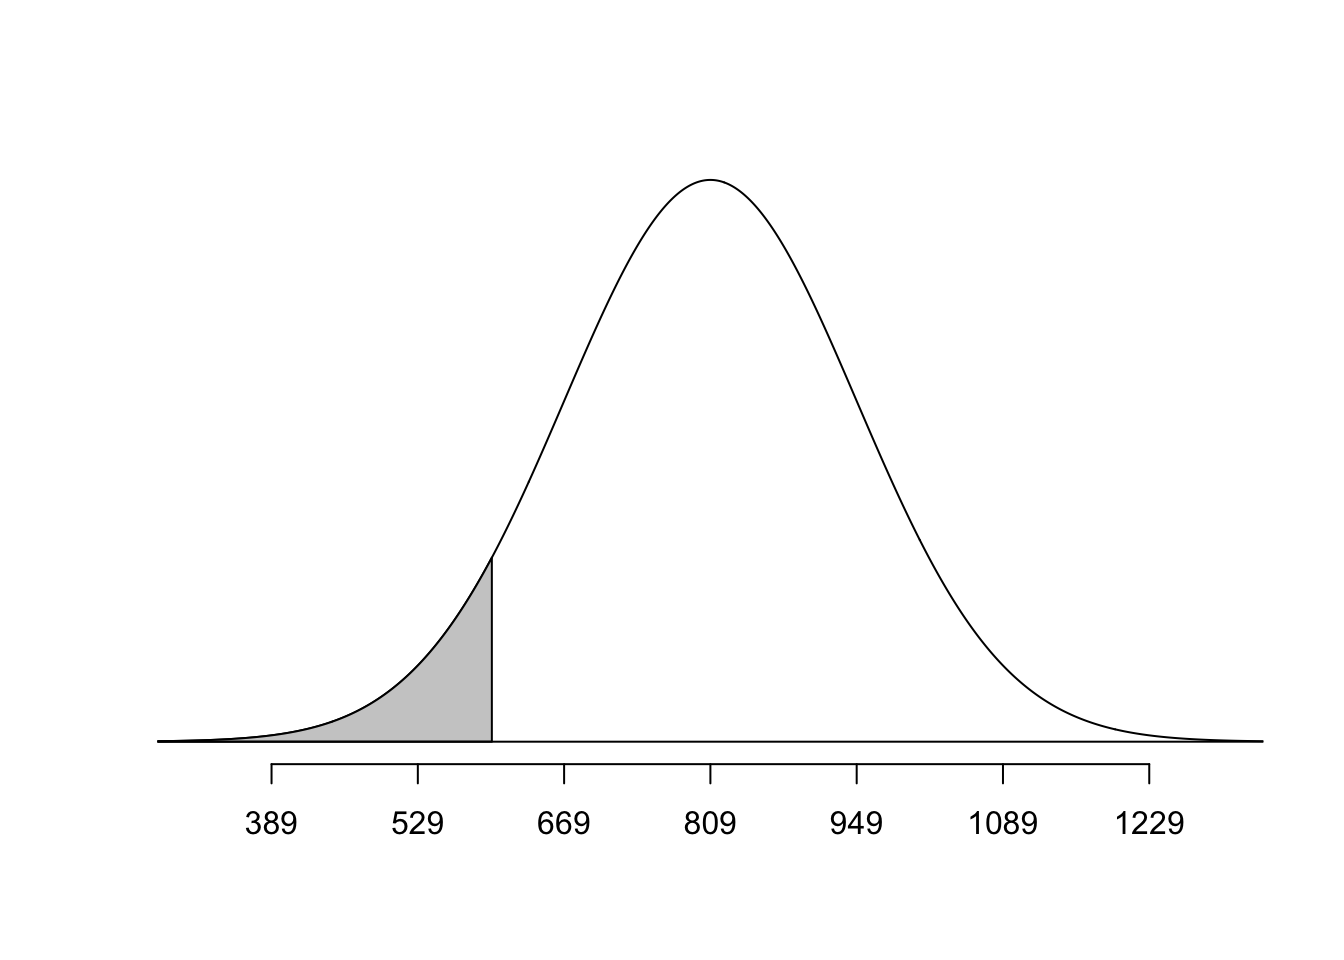
Exercise 5
Would you be surprised if a randomly selected 65-year-old woman had bone density less than Mahogany? What if she had bone density less than Plywood? Use the respective probabilities to support your response.
No for Mahogany, yes for Plywood.
# Mahogany
normTail(m = bone_density_mean, s = bone_density_sd, L = mahogany)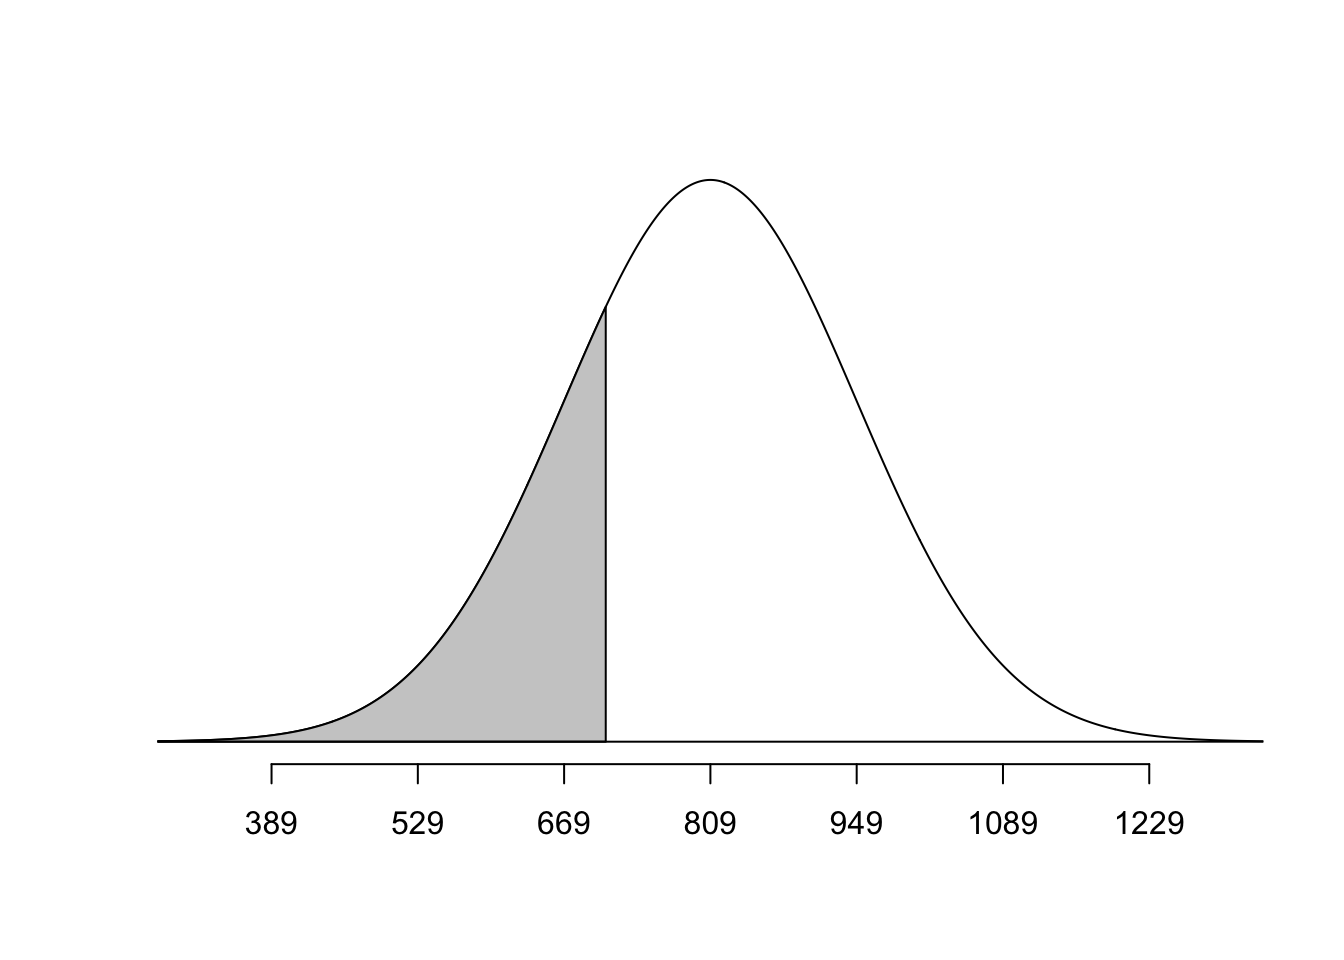
pnorm(q = mahogany, mean = bone_density_mean, sd = bone_density_sd)[1] 0.2397389# Plywood
normTail(m = bone_density_mean, s = bone_density_sd, L = plywood)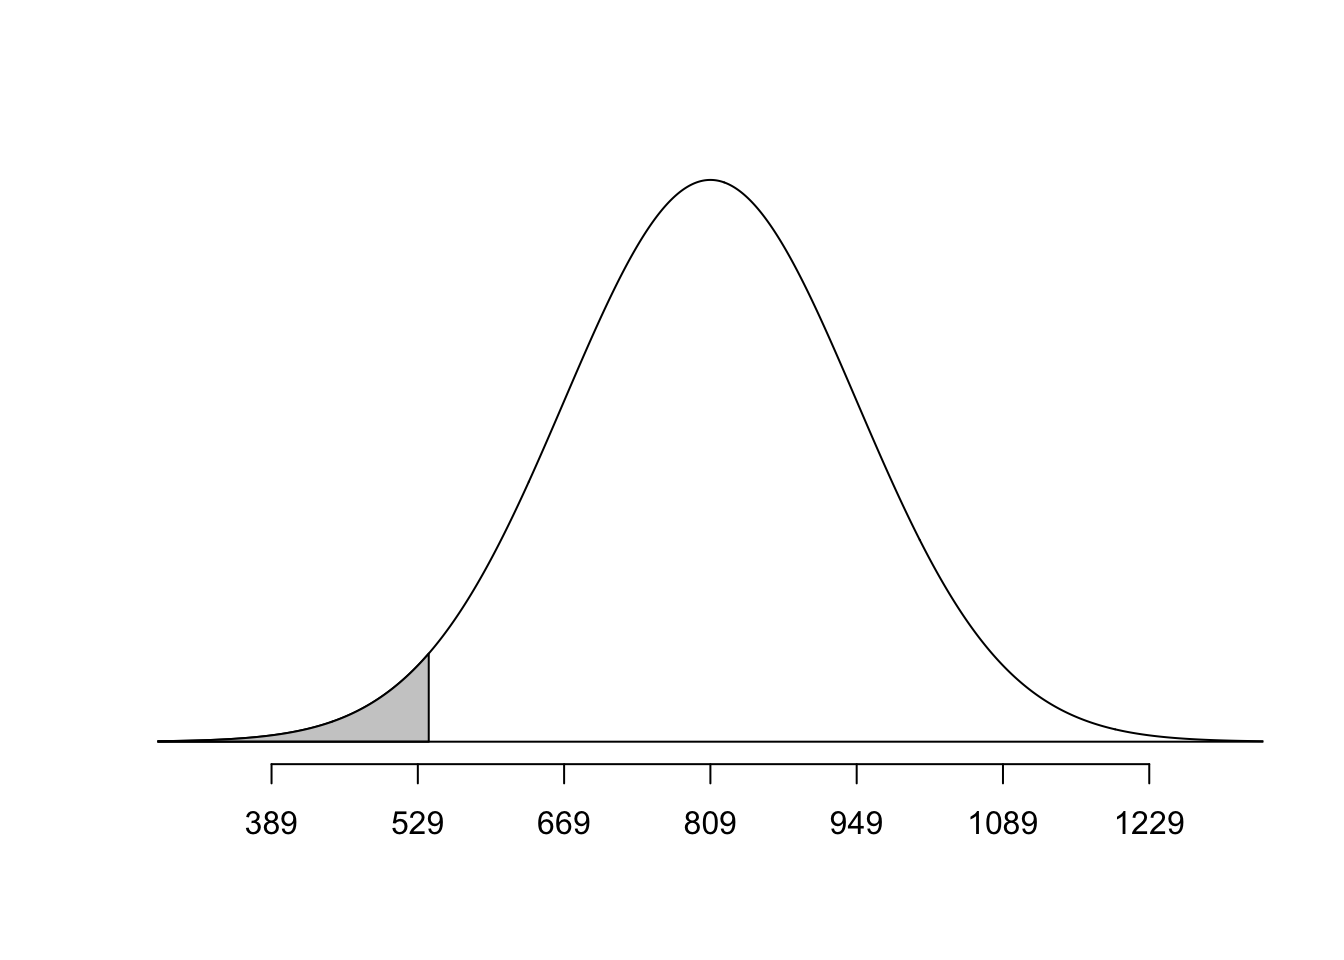
pnorm(q = plywood, mean = bone_density_mean, sd = bone_density_sd)[1] 0.02733885