Inference overview

Lecture 16

John Zito

Duke University
STA 101 Fall 2026

2026-10-29

Recap: statistical inference

The bottom line, at the top

  • Data science is the messy, real-world art of converting data into knowledge;
  • Statistics is the mathematical study of quantifying uncertainty about that knowledge to help guide decision-making.

The population model (greek letters, no hats)

  • This is an idealized representation of the data: \[ y = \beta_0+\beta_1x +\varepsilon; \]

  • There is some “true line” floating out there with a “true slope” \(\beta_1\) and “true intercept” \(\beta_0\);

  • With infinite amounts of perfectly measured data, we could know \(\beta_0\) and \(\beta_1\) exactly;

  • We don’t have that, so we must use finite amounts of imperfect data to estimate;

  • We are especially interested in \(\beta_1\) because is characterizes the association between \(x\) and \(y\), which is useful for prediction.

“Three branches of statistical government”

\(\beta_1\) is an unknown quantity we are trying to learn about using noisy, imperfect data. Learning comes in three flavors:

  • POINT ESTIMATION: get a single-number best guess for \(\beta_1\);

  • INTERVAL ESTIMATION: get a range of likely values for \(\beta_1\) that characterizes (sampling) uncertainty;

  • HYPOTHESIS TESTING: use the data to distinguish competing claims about \(\beta_1\).

Point estimation (roman letters, hats!)

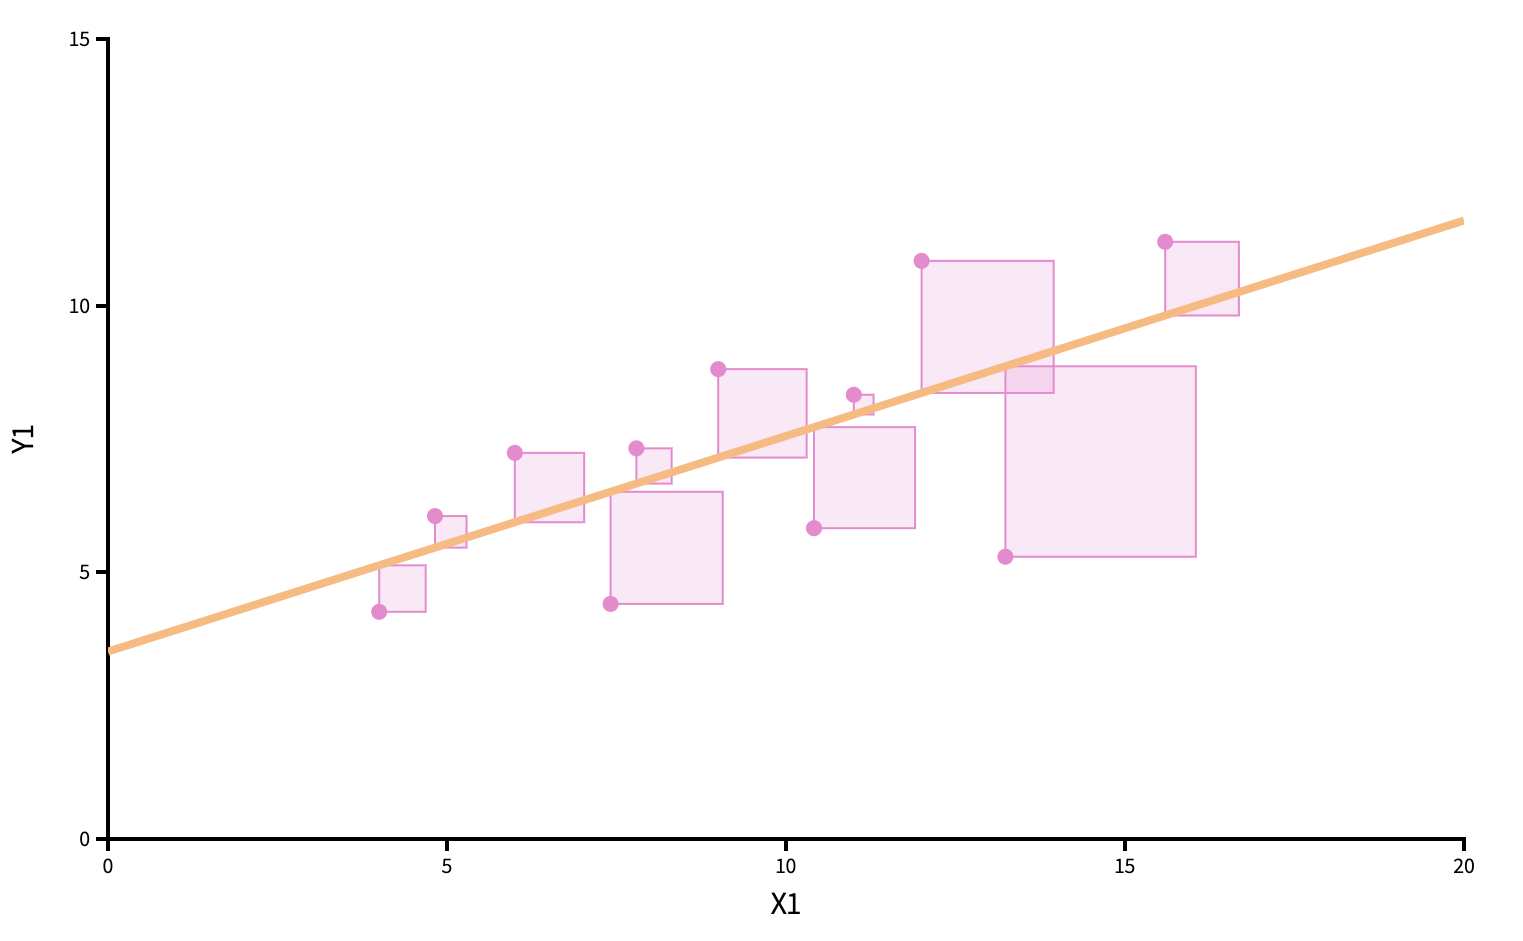
We estimate \(\beta_0\) and \(\beta_1\) with the coefficients of the best fit line:

\[ \hat{y}=b_0+b_1x. \]

“Best” means “least squares.” We pick the estimates so that the sum of squared residuals is as small as possible. Play around!
Point estimation
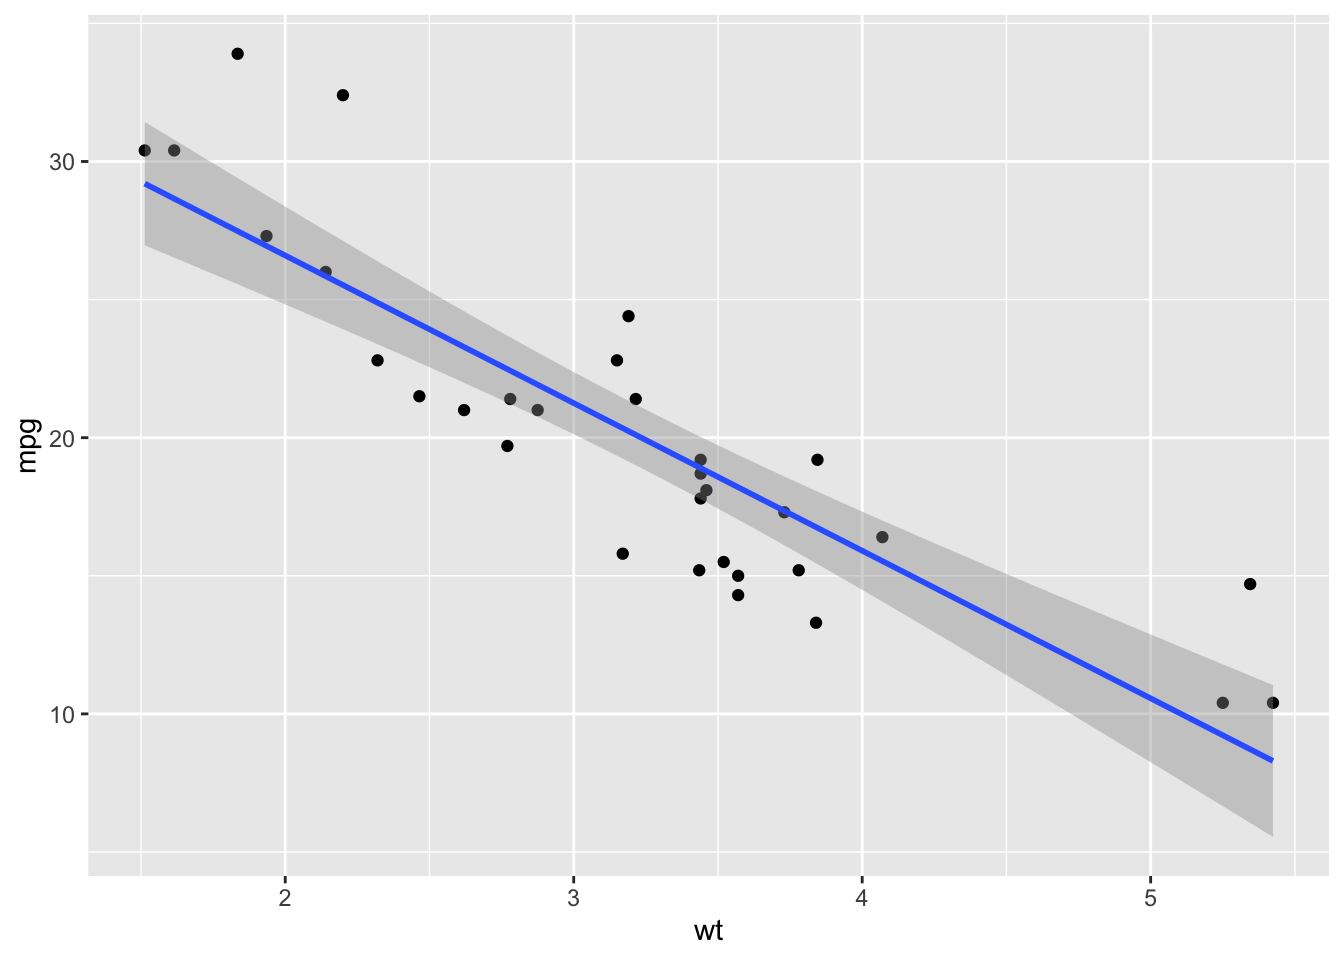
ggplot(mtcars, aes(x = wt, y = mpg)) + 
  geom_point() +
  geom_smooth(method = "lm")
`geom_smooth()` using formula = 'y ~ x'

Point estimation

linear_reg() |>
  fit(mpg ~ wt, data = mtcars) |>
  tidy()
# A tibble: 2 × 5
  term        estimate std.error statistic  p.value
  <chr>          <dbl>     <dbl>     <dbl>    <dbl>
1 (Intercept)    37.3      1.88      19.9  8.24e-19
2 wt             -5.34     0.559     -9.56 1.29e-10

Sampling uncertainty

  • How do our point estimates vary across alternative, hypothetical datasets?

    • If they vary alot, uncertainty is high, and results are unreliable;
    • if they vary only a little, uncertainty is low, and results are more reliable.
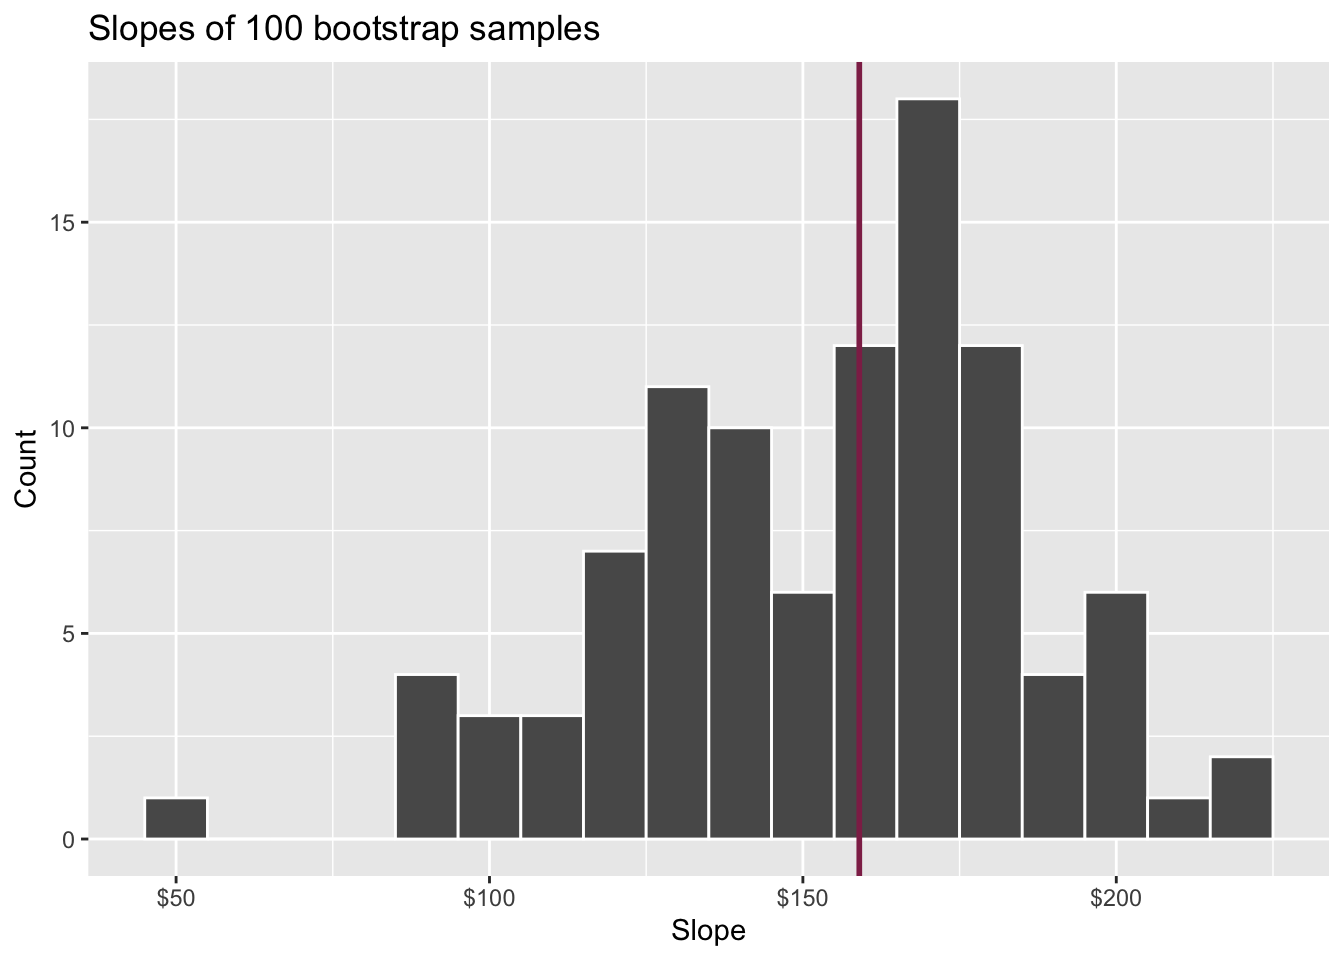
  • We can use the bootstrap to construct alternative datasets and assess the sensitivity of our estimates to changes in the data.

Bootstrap distribution

This histogram displays variation in the slope estimate across alternative datasets.

  • Large spread >> high uncertainty;
  • Small spread >> lower uncertainty.

Confidence interval

Pick a range that swallows up a large % of the histogram:
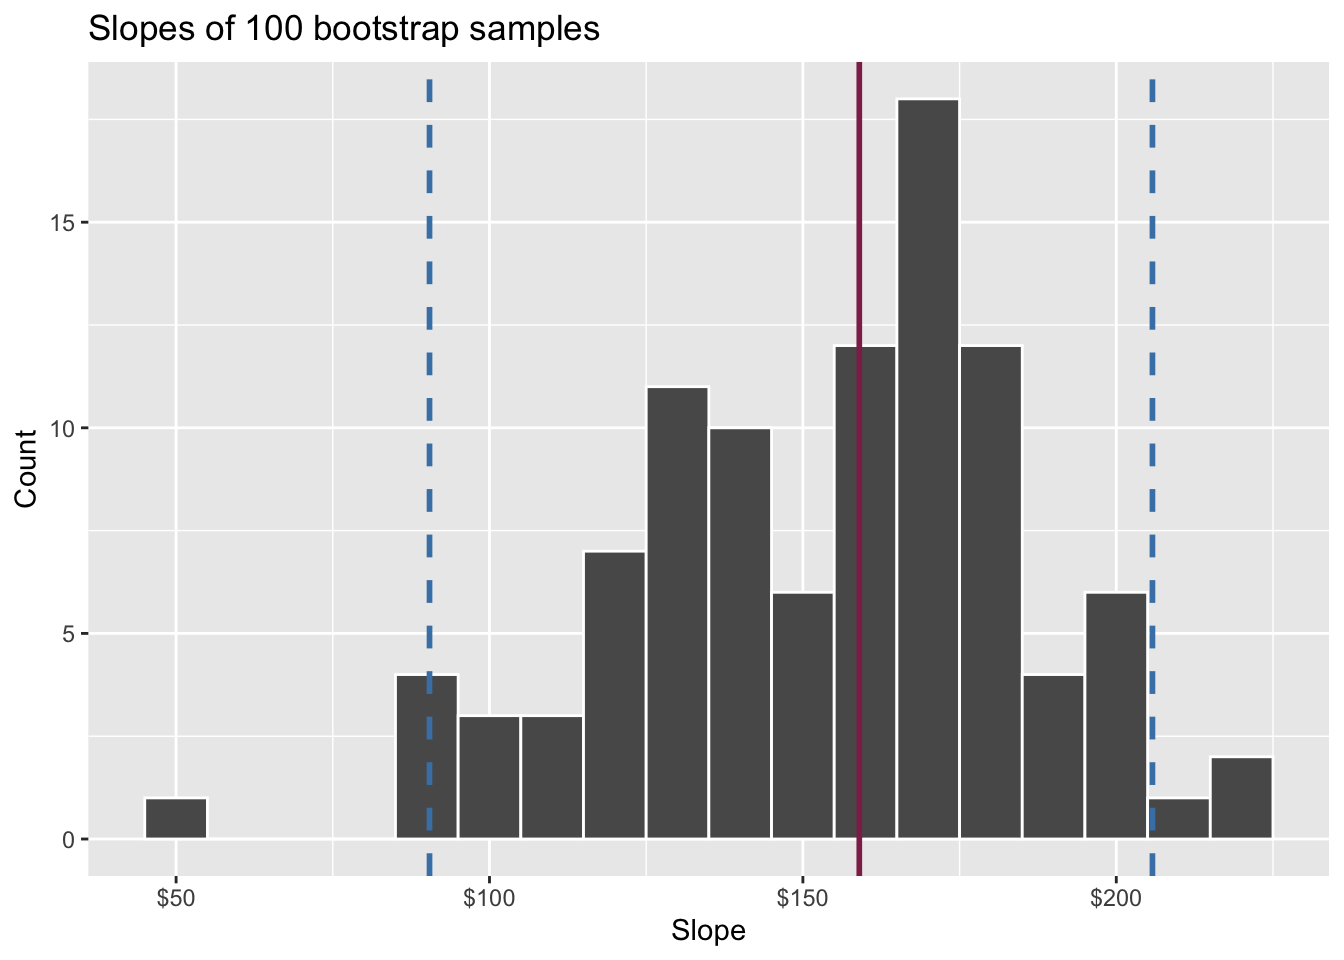
We use quantiles (think IQR) but there are other ways.

Hypothesis testing

  • Two competing claims about \(\beta_1\): \[ \begin{aligned} H_0&: \beta_1=0\quad(\text{nothing going on})\\ H_A&: \beta_1\neq0\quad(\text{something going on}) \end{aligned} \]

  • In words: “are x and y correlated or not?”

  • Do the data strongly favor one or the other?

  • How can we quantify this?

Hypothesis testing

  • Think hypothetically: if the null hypothesis were in fact true, would my results be out of the ordinary?

    • if no, then the null could be true;
    • if yes, then the null might be bogus;
  • My results represent the reality of actual data. If they conflict with the null, then you throw out the null and stick with reality;

  • How do we quantify “would my results be out of the ordinary”?

Null distribution

If the null happened to be true, how would we expect our results to vary across datasets? We can use simulation to answer this:
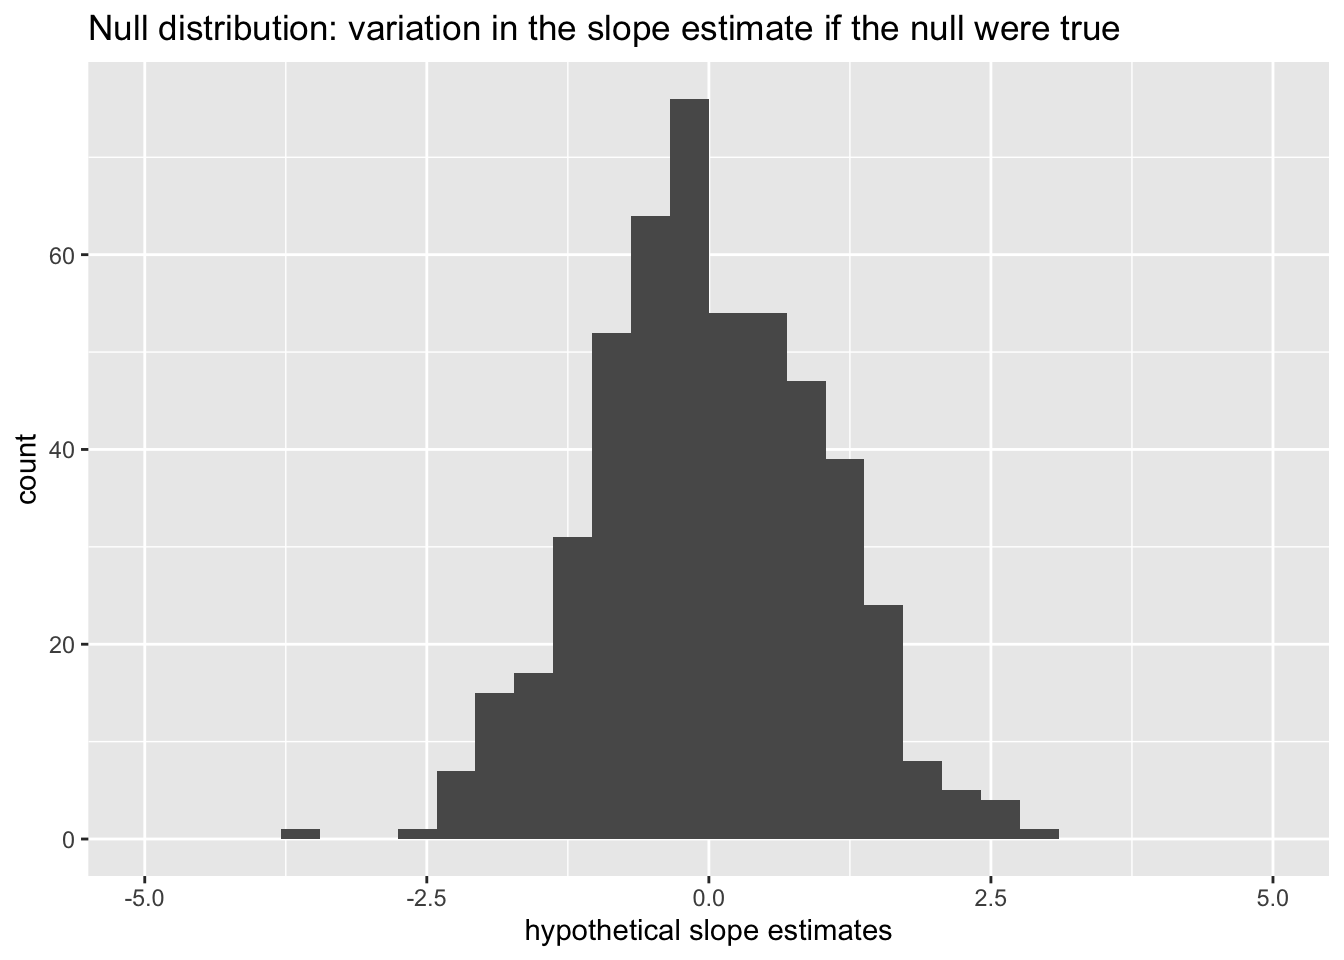
This is how the world should look if the null is true.

Null distribution versus reality

Locate the actual results of your actual data analysis under the null distribution. Are they in the middle? Are they in the tails?
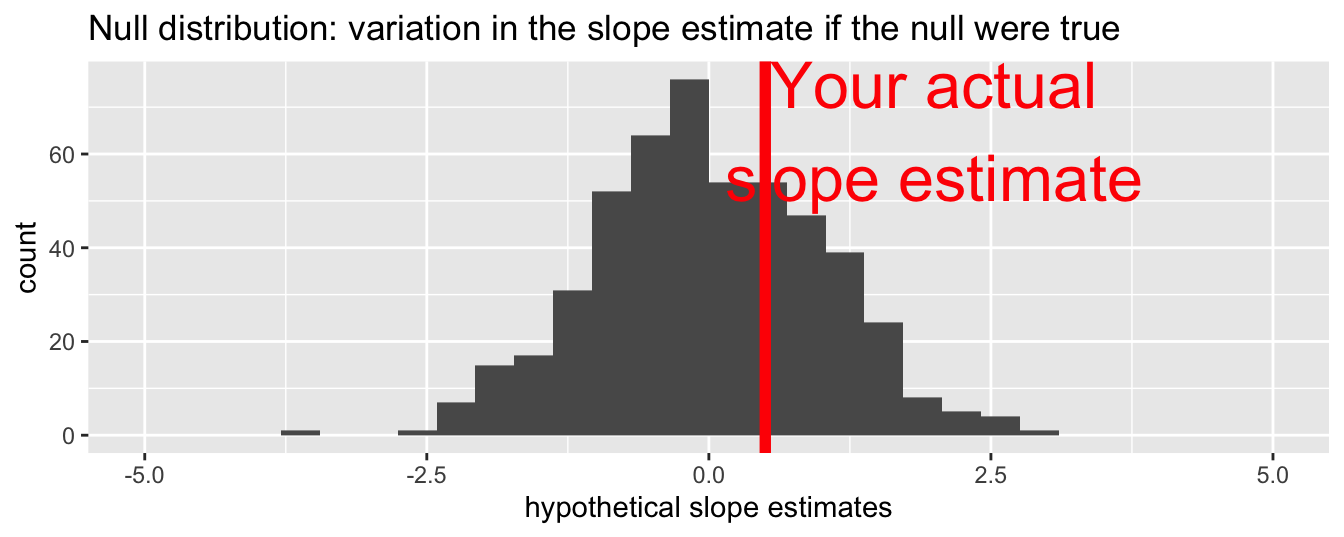
Are these results in harmony or conflict with the null?

Null distribution versus reality

Locate the actual results of your actual data analysis under the null distribution. Are they in the middle? Are they in the tails?
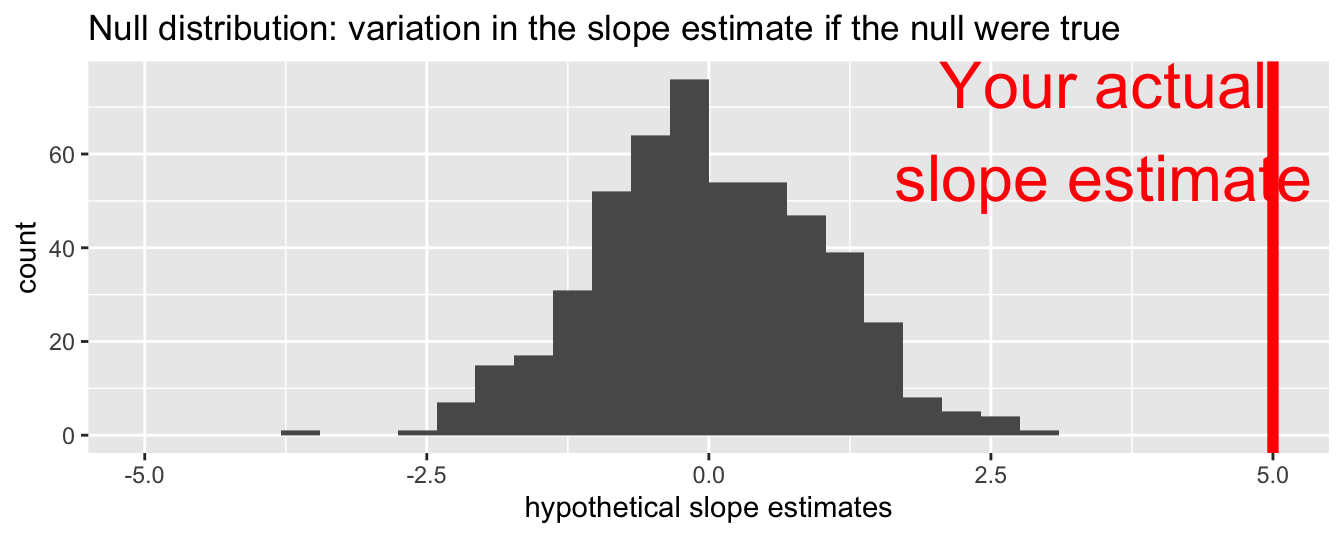
Are these results in harmony or conflict with the null?

Null distribution versus reality

Locate the actual results of your actual data analysis under the null distribution. Are they in the middle? Are they in the tails?
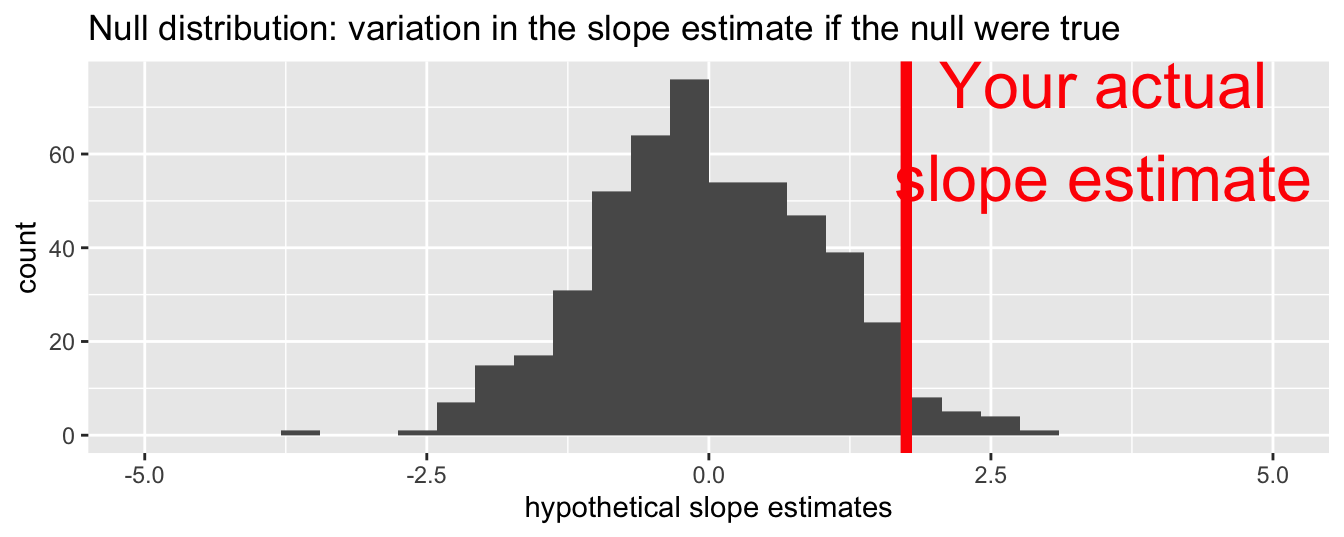
Are these results in harmony or conflict with the null?

The main idea

  • The point estimate is reality. That’s what the data say;
  • The null distribution is hypothetical;
  • Are the reality and the hypothetical in harmony or conflict?
    • If harmony, the null remains plausible and cannot be dismissed;
    • If conflict, go with reality (reject the null).
  • Instead of eyeballing a picture, how can we quantity the degree of “harmoniousness” between reality and the hypothetical?

p-value

The \(p\)-value is the probability of being even farther out in the tails of the null distribution than your results already were.

  • if this number is very low, then your results would be out of the ordinary if the null were true, so maybe the null was never true to begin with;

  • if this number is high, then your results may be perfectly compatible with the null.

p-value

p-value is the fraction of the histogram area shaded red:
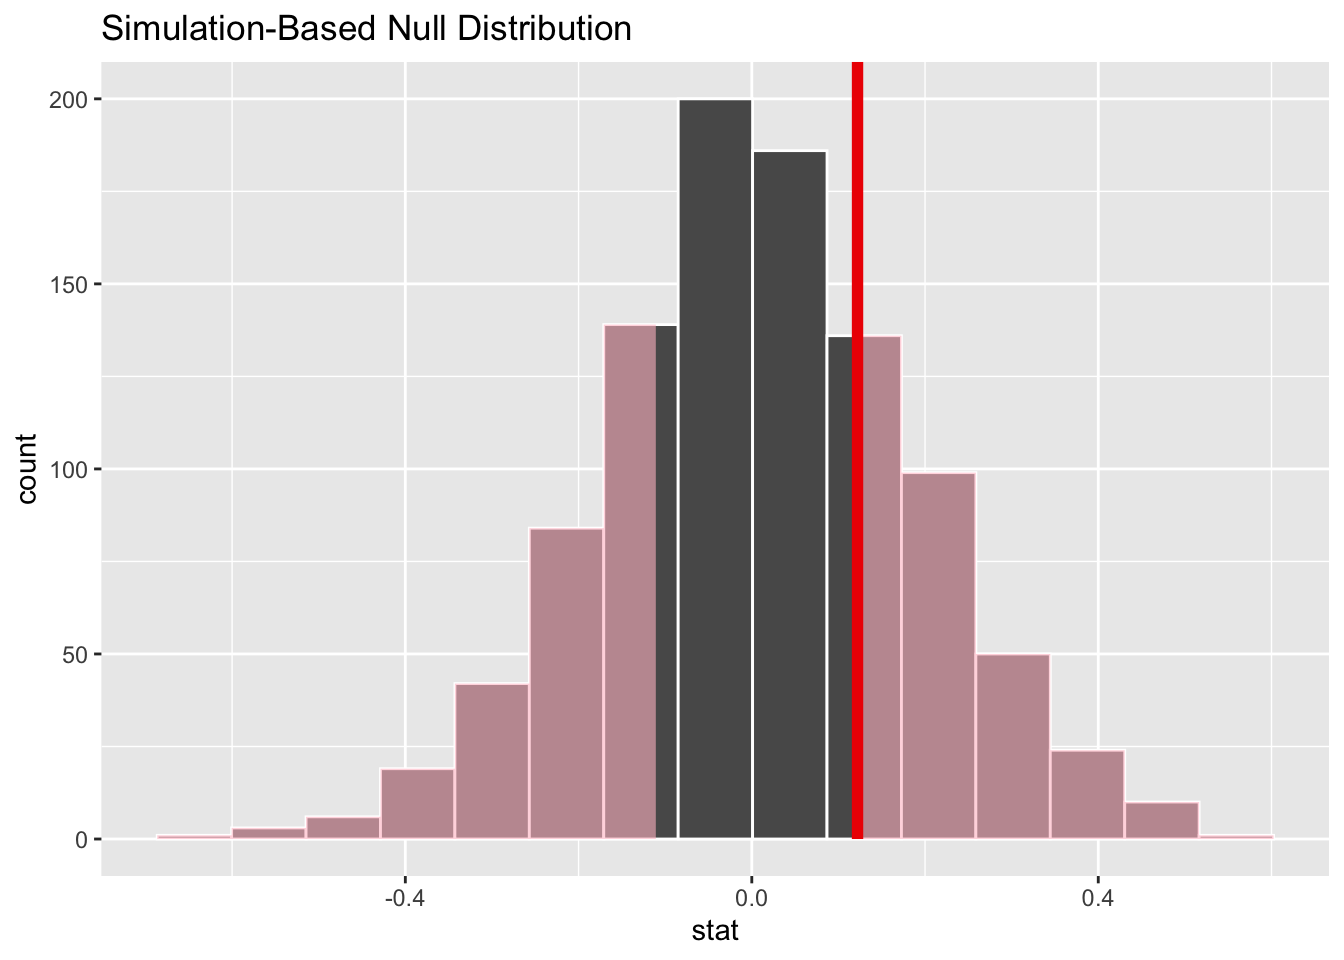
Big ol’ p-value. Null remains plausible

p-value

p-value is the fraction of the histogram area shaded red:
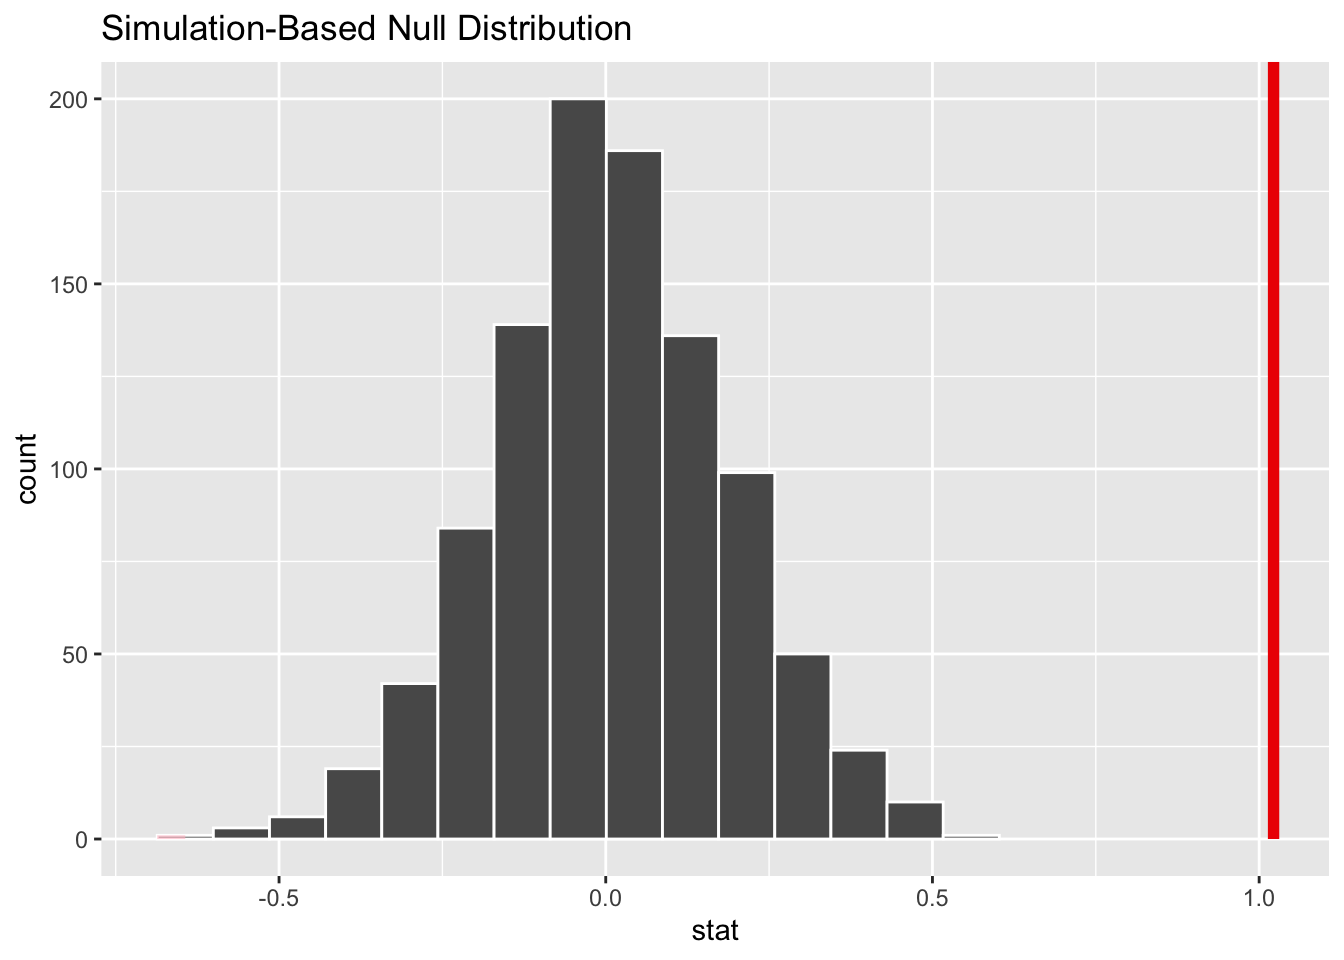
p-value is basically zero. Null looks bogus.

p-value

p-value is the fraction of the histogram area shaded red:
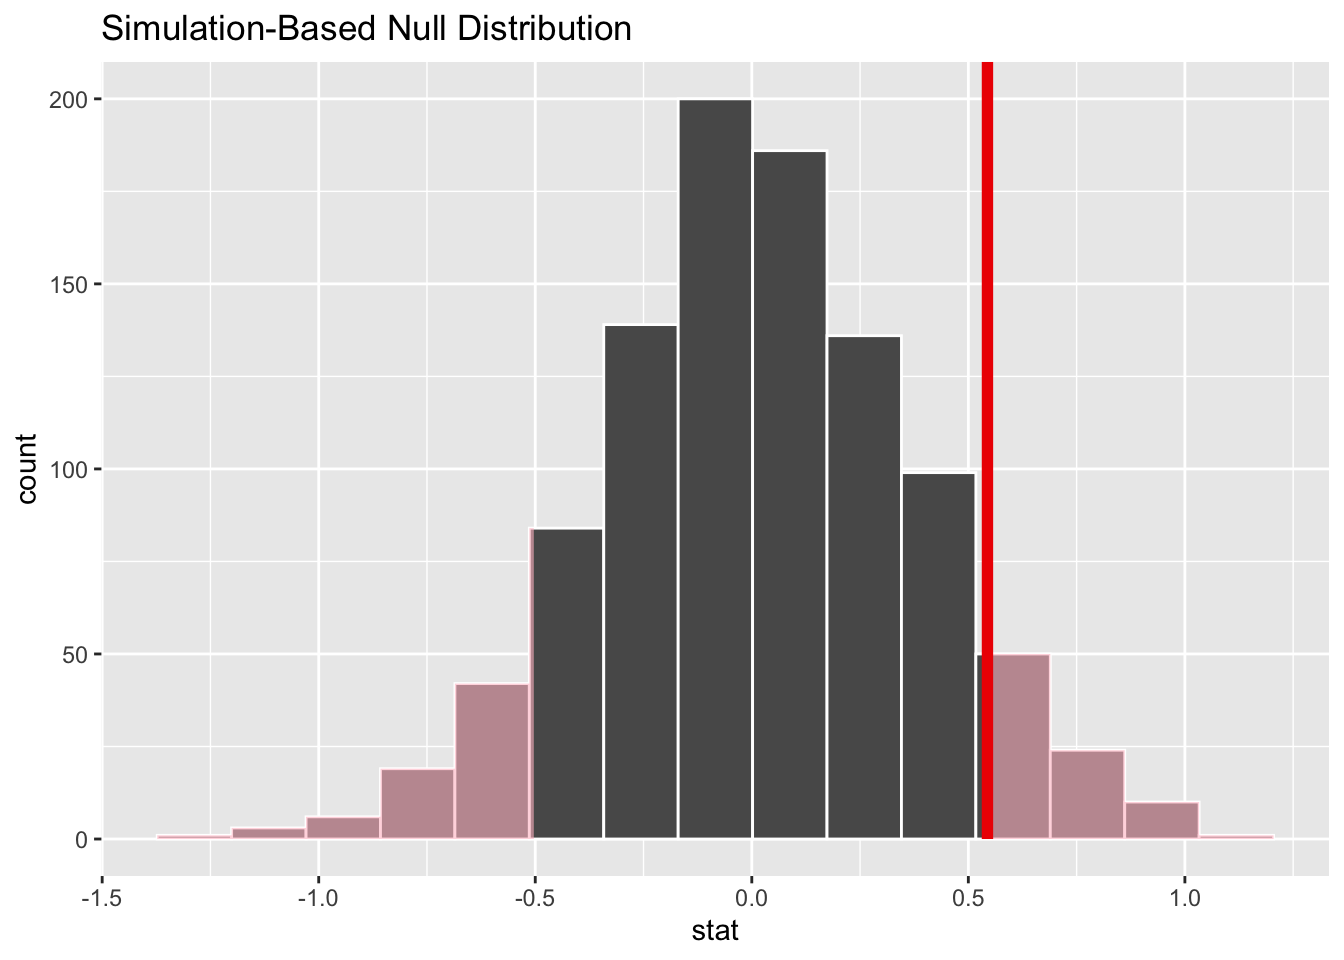
p-value is…kinda small? Null looks…?
Discernibility level

  • How do we decide if the p-value is big enough or small enough?

  • Pick a threshold \(\alpha\in[0,\,1]\) called the discernibility level:

    • If \(p\text{-value} < \alpha\), reject null and accept alternative;
    • If \(p\text{-value} \geq \alpha\), fail to reject null;
  • Standard choices: \(\alpha=0.01, 0.05, 0.1, 0.15\).

Coming up

We will spend the month of November practicing the following:

  • taking great care to interpret confidence intervals correctly;
  • taking great care to interpret p-values correctly;
  • using mathematical methods (ie. not simulation) to approximate the sampling and null distributions;
  • thinking about statistical problems beyond simple linear regression.